
DAX - Consolidation in an intact upward trend

DAX analysis for Wednesday, July 16, 2025
Last week, the DAX confirmed its uptrend by rising to new highs on July 10. However, the overbought situation above the Bollinger Bands and in the Slow Stochastics triggered a technical counter-reaction. This caused the index to fall back into the Bollinger Bands with two consecutive gap-downs, triggering a sell signal in the Slow Stochastics. The latter was triggered when the oscillator's green signal line fell below the red line. Meanwhile, the relative proximity to the all-time high, the upwardly widening Bollinger Bands, and the buy signals from the 20-day moving average, 50-day moving average, and 200-day moving average could favor a trend continuation after the ongoing consolidation. In this scenario, the daily high of July 15 at 24,268 points (resistance 1) marks the first barrier. A rise above this hurdle could encourage follow-on buying up to the daily low of July 10 at 24,454 points (Resistance 2). Touching this price level would, in turn, close a remaining gap. The uptrend could then extend toward the upper Bollinger Band and up to last week's highs. Investors expect momentum today, particularly from the US, where the Producer Price Index and industrial production for June will be released. The DAX is priced at a -0.2% decline in premarket trading. The long scenario is invalidated if the DAX falls below the 23,699 point mark (Support 2).
» Preferred scenario: Bulls gather strength for trend continuationTechnically, the DAX has developed a long-term uptrend. This trend was confirmed by the price increase to new highs on July 10. The overbought market subsequently triggered a technical counter-reaction, which also triggered a sell signal in the Slow Stochastic. However, the temporary respite could lay the foundation for the next uptrend. This scenario is currently confirmed, in particular, by the relative proximity to the all-time high and the upwardly widening Bollinger Bands, as well as the buy signals from the 20-day moving average, the 50-day moving average, and the 200-day moving average.
Statistically, since January 2, 2000, there is a 65% probability of a 1% rally occurring in the next 5 trading days after the formation of a gap down.
In this scenario, the daily high of July 15 at 24,268 points (resistance 1) marks the first hurdle. A rise above this hurdle could, in turn, trigger follow-on buying up to the daily low of July 10 at 24,454 points (resistance 2). Touching this price level would, in turn, close any remaining price gap. Various derivative products are available as an investment opportunity in the DAX. One example is the ENDLESS TURBO LONG 21,153.16 OPEN END: UNDERLYING DAX from DZ BANK (WKN: DY9YKM )* with a strike price of 21,153.16 points. The leverage is approximately 8.30 on July 16, 2025, at 7:00 a.m. The long scenario is invalidated if the DAX falls sustainably below the support level of 23,699 points (support 2). Please note the product risks described below in this document.
» Counter scenario: Sell signal confirms price weaknessOn July 10, the DAX formed an all-time high in the overbought zone above the upper Bollinger Band. Subsequently, a technical counter-reaction was triggered to reduce the overbought situation, leading the index back into the Bollinger Bands with two consecutive gap downs. The price weakness, in turn, triggered a sell signal from the Slow Stochastic, which remains in effect today. After a temporary recovery, which culminated in a lower all-time high on July 15, the DAX has potentially laid the foundation for the next wave of selling.
Statistically, since January 2, 2000, there is a 48% probability of a 1% price decline in the next 5 trading days after the formation of a "Gab Down."
In this scenario, the red daily candle from July 15th and the resulting all-time high could favor subsequent losses today. In this scenario, the all-time low from July 14th at 23,973 points (support 1) marks the first holding area. A sustained sell-off below this holding area could lead the price to the 20-day moving average and the 50-day moving average. Only if both moving averages are sustained undercut could the resulting sell signals generate accelerating downward momentum. In this scenario, the local minimum from July 4th at 23,699 points (support 2) marks the potential second holding area. Various derivative products are available as an investment opportunity in the DAX. One example is the ENDLESS TURBO SHORT 27,075.90 OPEN END: UNDERLYING DAX from DZ BANK (WKN: DU01D5 )* with a strike price of 27,075.90 points. The leverage is 7.89 on July 16, 2025, at 7:00 a.m. The short scenario is invalidated if the DAX rises above the 24,454 point mark (resistance 2). Please note the product risks described below in this document.
If you would like to receive regular information from DZ BANK, you can subscribe to the various publications on trading and investing free of charge:

You are about to purchase a product that is not simple and may be difficult to understand. Complete information on the above-mentioned products, in particular the binding terms and conditions, risks, and information about DZ BANK, can be found in the relevant prospectus.
The base prospectuses prepared by DZ BANK in accordance with legal requirements regarding the public offering, as well as any supplements and the respective Final Terms, are published on DZ BANK's website www.dzbank-wertpapiere.de and can be accessed at www.dzbank-wertpapiere.de/DY9YKM or www.dzbank-wertpapiere.de/DU01D5 (under "Documents"). You should read the prospectus before making an investment decision in order to fully understand the potential risks and rewards of the decision to invest in the securities. The approval of the prospectus by the competent authority does not constitute an endorsement of the securities being offered or admitted to trading on a regulated market. The current version of the key information documents prepared by DZ BANK is also available on the DZ BANK website at www.dzbank-wertpapiere.de/DY9YKM or www.dzbank-wertpapiere.de/DU01D5 (under "Documents"). This applies as long as the product is available to private investors.
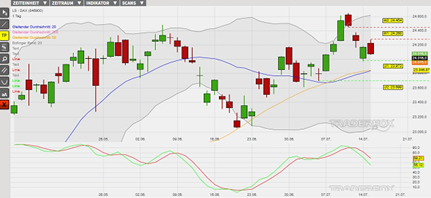
The chart shows the past performance of the Slow Stochastic indicator. Future results may be lower or higher. Source: https://www.dzbank-wertpapiere.de/markets/daxanalyse
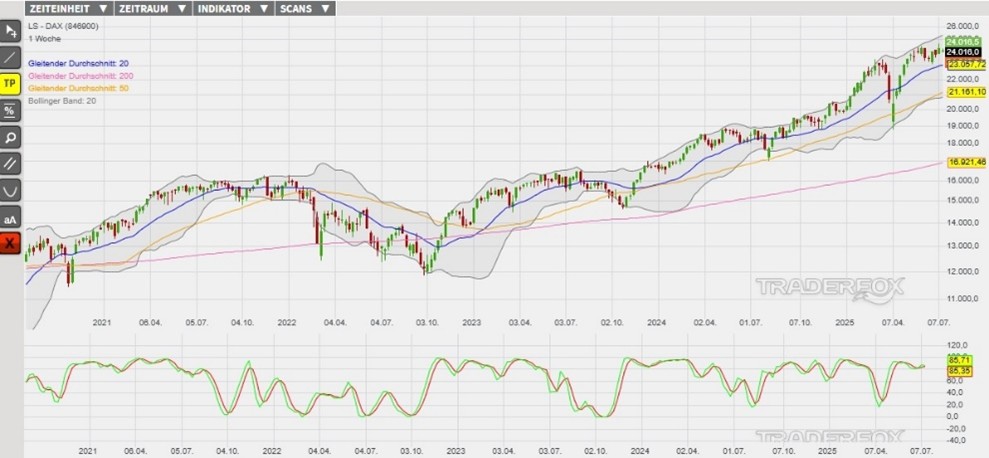
The chart shows the past performance of the Slow Stochastic indicator. Future results may be lower or higher. One candlestick in the chart represents one trading week. Source: https://www.dzbank-wertpapiere.de/markets/daxanalyse
You are about to purchase a product that is not simple and may be difficult to understand.
The current version of the key information document prepared by DZ BANK for the aforementioned products is available on the DZ BANK website at https://www.dzbank-wertpapiere.de/DY9YKM or https://www.dzbank-wertpapiere.de/DU01D5 (under "Documents"). This applies as long as the respective product is available to private investors.
Complete information on the two aforementioned products, in particular on the binding terms and conditions, risks, and information about DZ BANK, can be found in the relevant prospectus. The base prospectus prepared by DZ BANK in accordance with legal requirements for the public offering, as well as any supplements and the respective Final Terms, are published on DZ BANK's website https://www.dzbank-wertpapiere.de and can be accessed at https://www.dzbank-wertpapiere.de/DY9YKM or at https://www.dzbank-wertpapiere.de/DU01D5 (there, in each case, under "Documents"). You should read the relevant prospectus before making an investment decision in order to fully understand the potential risks and opportunities associated with investing in the respective securities. The approval of the relevant prospectus by the competent authority does not constitute an endorsement of the securities offered or admitted to trading on a regulated market.
Every day before the stock market opens, the technical analysts at TraderFox provide an assessment of the DAX – both as a PDF and as a video: https://www.dzbank-wertpapiere.de/markets/daxanalyse
A notice:
Statements regarding past performance, simulations, or forecasts of financial instruments or financial indices do not constitute a reliable indicator of future performance. Therefore, no guarantee can be given for the future price, value, or return of any financial instrument or financial index mentioned in this document.
The success probabilities for the "Gap Down" signal are based on a historical evaluation of the signal on the LS-DAX from January 2, 2000, to July 15, 2025. The following presets and filters were applied:
- Chart signal: Gap Down. Change: 0.003
- Performance < 2.50% Periods: 10
- Performance < 0.00% Periods: 1
- Slow stochastic % k > 56.00 stats.periods_smooth: 3stats.periods_stochastic: 14
- Performance > 2.00% Periods: 20
» GlossarDownward trend
A downtrend is a situation in which the low of each successive price rally is lower than that of the previous rally, and each high is also lower than the previous high. In other words, a downtrend is a pattern of falling peaks and troughs.
Bollinger Bands
The Bollinger Bands are a relative reference system designed to indicate whether a market is heavily overbought or oversold. The system was developed by John Bollinger in the 1970s. The Bollinger Bands are plotted on a market chart using a 20-day moving average (MA). The lower Bollinger Band is plotted 2 standard deviations below the 20-day moving average. The upper Bollinger Band is plotted 2 standard deviations above the 20-day moving average. Assuming a normal distribution of price movements, around 95% of all market prices lie within the Bollinger Bands. If a market falls sharply and is significantly below the Bollinger Bands, it can be said to be oversold. If a market rises sharply and is significantly above the upper Bollinger Band, it can be said to be overbought.
divergence
A situation in which two indicators do not confirm each other. In oscillator analysis, for example, this is the case when prices are rising while one oscillator is already beginning to fall. Divergences typically warn of a trend reversal. The opposite of divergence is confirmation.
Doji
A doji is a candlestick or bar where the opening and closing prices are at the same price level. The doji primarily signals indecision or a pause in price movement. The doji typically occurs during consolidations or sideways movements, but also at the end of price movements.
double top
This price formation features two distinct peaks. The trend reversal is complete when the middle trough is broken down. The double bottom is a mirror image of the double top.
Fibonacci retracement
Leonardo Fibonacci was an Italian mathematician who discovered relationships between numbers. Each Fibonacci number is calculated from the sum of the two preceding Fibonacci numbers. It begins with 0, resulting in the following sequence: 0, 1, 1, 2, 3, 5, 8, 13, 21, 34, 55, 89, 144... If you now consider the relationship between all the Fibonacci numbers, you'll see a repeating pattern.
Dividing one number by the next number produces a result close to 0.618 as the values increase.
Dividing a number in this series by the number preceding it results in a value close to 1.618.
Dividing a number in the series by the number two places later results in a value close to 0.382.
The two ratios of one number to the next higher (0.618) and the number to the next lower (1.618) are also known as the "golden ratio" or "golden mean" and can be found not only in mathematics, but also in music, art, architecture and biology.
The higher the numbers, the closer the result is to this ratio. The ratios of these numbers to each other result in the percentages 38%, 50%, and 63%. Traders use these values to determine targets for a price correction. There is no statistical evidence for the success of these retracements.
Gap
Price gaps are empty spaces that appear on a bar chart at price levels where no trading has taken place. An up gap occurs when the lowest price of one trading day is higher than the highest price of the previous day. A gap up is typically a sign of market strength, while a gap down is a sign of market weakness. The three main types of price gaps are breakout gaps, continuation gaps, and exhaustion gaps.
Gap Down
A gap down is a price gap that occurs between prices on a chart. The downward movement is so strong that no trading takes place in between. The first trade then occurs at a price that represents a gap from the previous price.
The widening gaps reflect an imbalance between supply and demand. There is a supply surplus.
Gap Up
A gap up is a price gap that occurs between prices on a chart. The upward movement is so strong that no trading takes place in between. The first trade then occurs at a price that represents a gap from the previous price.
The widening gaps reflect an imbalance between supply and demand. There is excess demand.
GD 200
200-day moving average (MA) stands for the 200-day moving average. The 200-day line is one of the simplest and most well-known tools in chart analysis. It is calculated by calculating the arithmetic mean of the closing prices of the past 200 trading days for each day and then connecting the individual average prices.
The 200-day moving average is used as a trend-following indicator. If a stock's 200-day moving average breaks down from top to bottom, chart technicians call it a sell signal. If the opposite happens, it acts as a buy signal.
Long scenario
The market participant is betting on a price increase.
oscillator
An indicator that determines whether a market is overbought or oversold. The market is overbought when the oscillator reaches an upper extreme. The market is oversold when the oscillator reaches a lower extreme.
Head and shoulders formation
The most well-known of the reversal patterns. At a market peak, three distinct peaks form, with the middle peak (or head) slightly higher than the other two peaks (shoulders). When the trend line (neckline) connecting the two intermediate troughs is broken, the pattern is complete. A bottom pattern is the mirror image of the top pattern; it is called an inverted or inverse head and shoulders pattern.
Shooting Star
The shooting star is characterized by a small body at the lower end of the price range and a long upper shadow. The color of the body is irrelevant. The price pattern provides an initial warning that upward momentum is losing steam and that a rally has been sold off during trading. The ideal shooting star candlestick body is located above the previous trading day and opened with a price gap.
Short scenario
The market participant is betting on a price decline.
Slow Stochastics
Stochastics is a mathematical method for calculating probabilities in random processes. The Slow Stochastic indicator is used to search for reversal points in the market. The indicator is of technical relevance for chart analysis when identifying reversal points during periods of sideways movement and developing slight trends. The indicator should be used in conjunction with other indicators or chart patterns.
The indicator consists of two lines: a faster green line, called the %K, and a slower red line (%D). Signals occur when the two lines intersect and/or pass through the level on the scale. The two lines can take values between 0 and 100. According to theory, values above 70-80 indicate that the market is currently overbought. Values below 20-30, on the other hand, indicate an oversold condition.
A buy signal occurs when the %K line crosses the %D line from bottom to top. A sell signal is generated when the %K line crosses the %D line from top to bottom.
When the %K line breaks above the %D line in the 20-30 range or lower, a buy signal is generated. Similarly, a sell signal is generated. When the %K line is in the 70-80 range or higher and breaks below the %D line, a sell signal is generated.
Overbought
A term used in connection with an oscillator. When an oscillator reaches an upper extreme, it is assumed that the market has risen too much and is vulnerable to a price collapse.
Oversold
A term used in connection with an oscillator. When an oscillator reaches a lower extreme, it is assumed that the market has fallen too far and is ripe for a recovery.
Support
A price or price range below the current price where buying power is sufficient to halt a price decline. A previous reaction low usually forms a support line.
Resistance
The opposite of support. Resistance occurs at the level of a previous price high, acts as a barrier above the market price, and can stop a price increase. (See support.)
If you would like to receive regular information from DZ BANK, you can subscribe to the various publications on trading and investing free of charge:
nachrichten-aktien-europa


